Top 10 Car Dealership KPIs to Align Expenses with Gross Profit
Your dealership sales are high. But the sales are not reflecting high profits. Confused?
Many car dealers are hitting or exceeding sales targets, yet still struggling to grow their bottom line. Without clear visibility into how expenses are tracking against gross profit, hidden costs, bloated overhead, and inefficient departments can quietly erode profitability.
That’s the real challenge: it’s not just about how much you sell, but how well you manage what you keep.
To solve this, forward-thinking dealerships are shifting focus from volume-driven metrics to performance KPIs that provide actionable financial insight. The right KPIs help you spot where margins are slipping, realign departments around profitability, and make smarter, faster decisions grounded in real data, not gut instinct
In this blog, we’ll discuss the 10 most essential car dealership KPIs every dealership should monitor to control costs, optimize performance, and build long-term financial strength.
Why Do KPIs Matter in Automotive Expense Management?
Before diving into specific KPIs, it’s essential to understand their significance. KPIs are measurable benchmarks showing how well your dealership performs against specific financial and operational goals. When it comes to managing expenses about gross profit, the right KPIs help automotive retailers:
- Pinpoint areas of overspending across sales, service, advertising, and staffing.
- Compare performance against industry benchmarks like NADA standards or manufacturer metrics.
- Improve operational efficiency in F&I, parts and service, and inventory management.
- Drive profitability with data-backed decisions instead of guesswork or outdated reports.
By embedding KPI tracking into daily operations, dealership leaders can gain real-time visibility into cost drivers, tighten up inefficiencies, and ultimately protect their profit margins, even during market volatility or slower vehicle sales.
10 Must-Know Car Dealership KPIs to Improve Dealership Profits
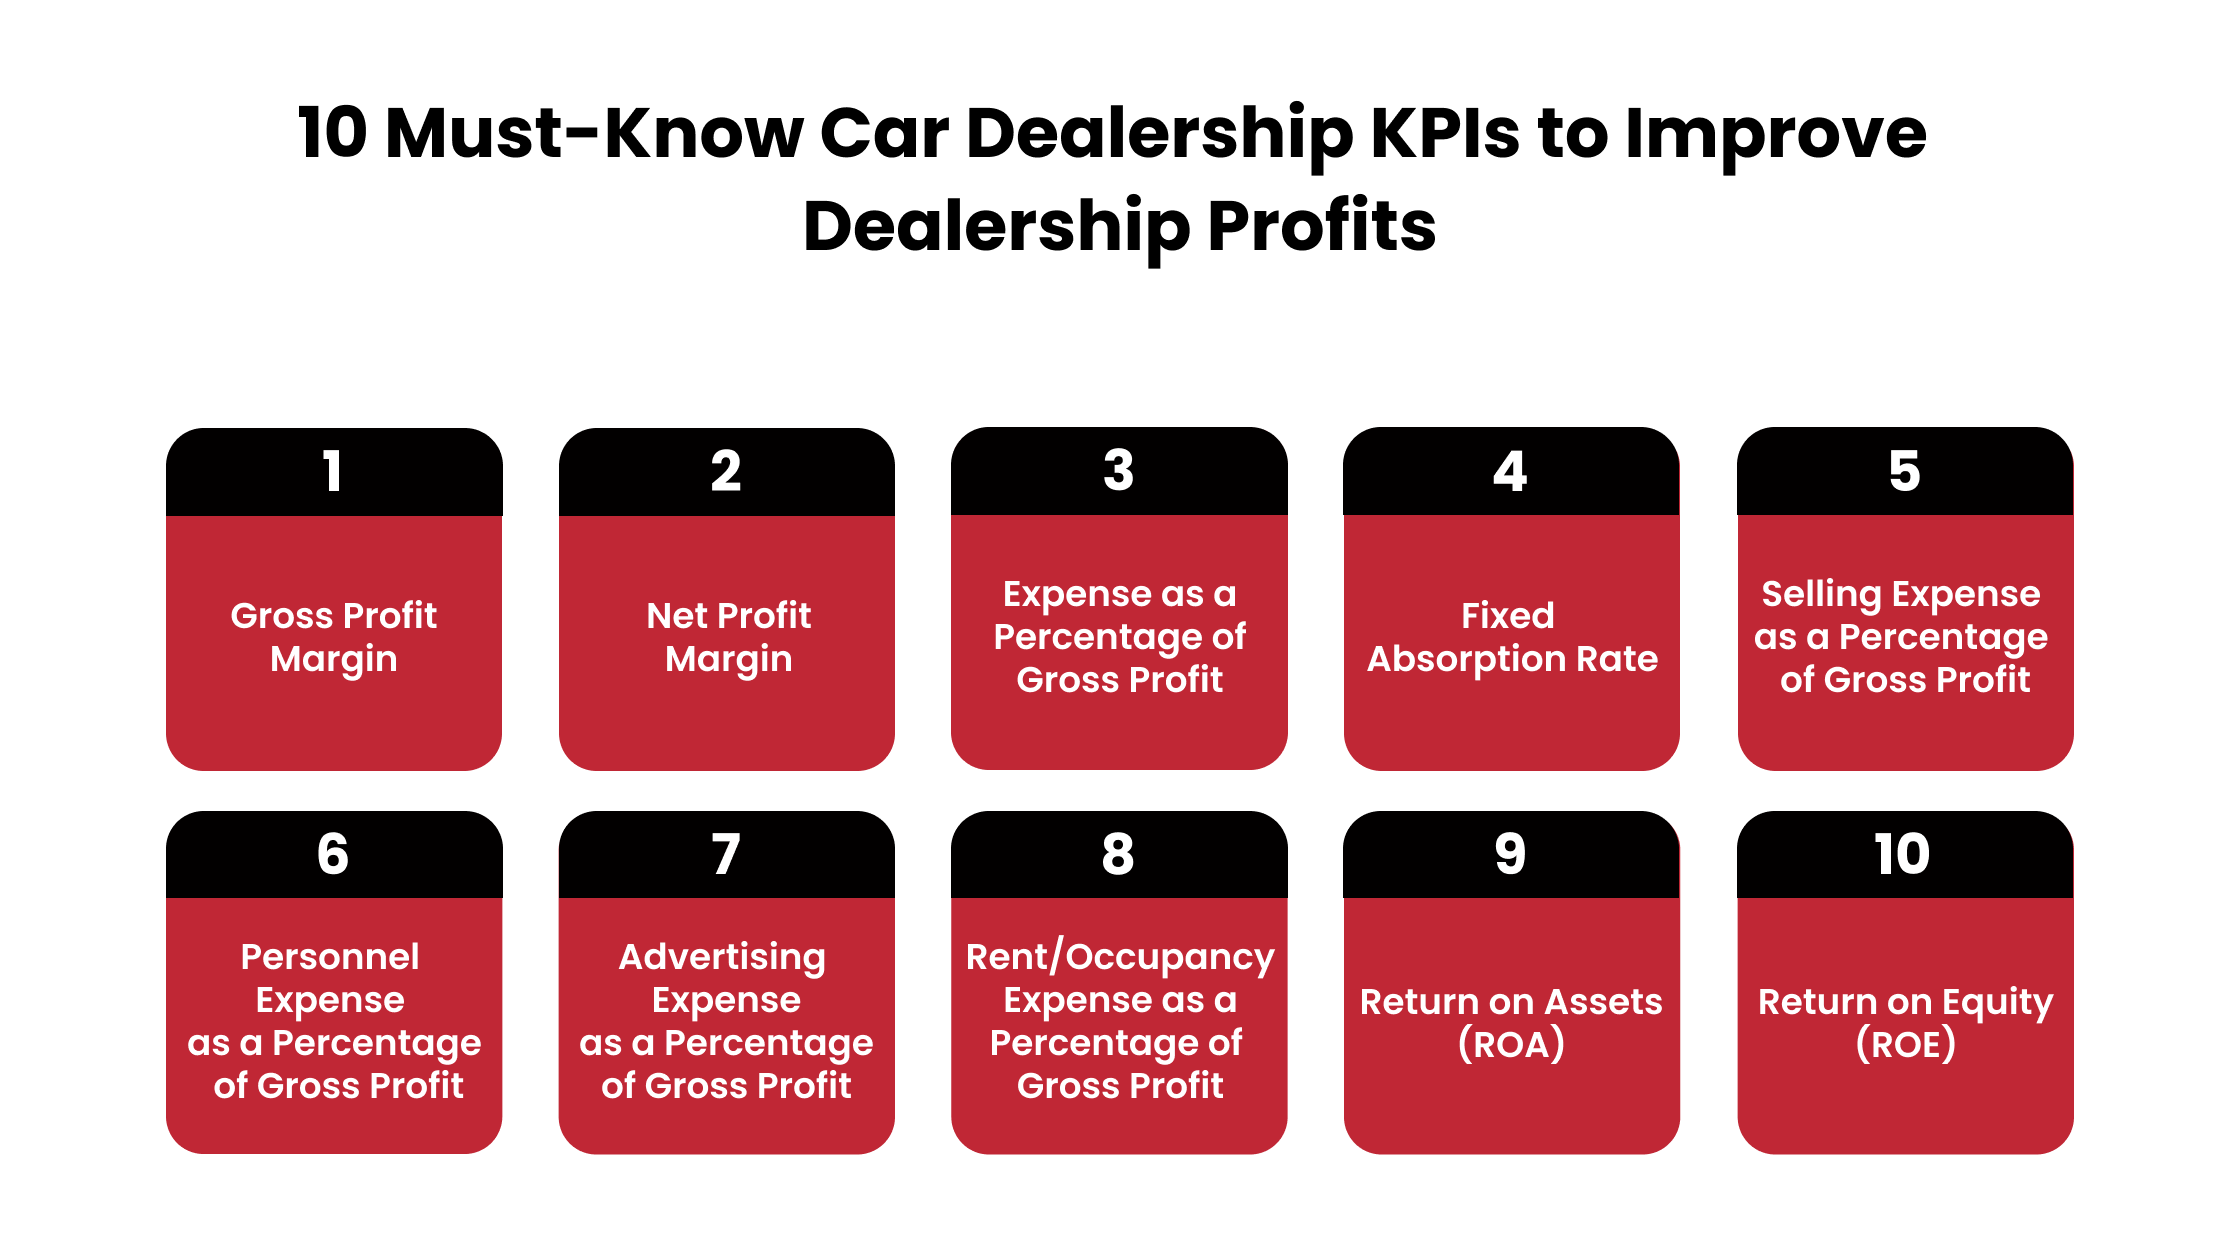
To run a successful dealership, you need more than great sales. You need solid financial insights. These 10 key performance indicators (KPIs) help you spot profit leaks, optimize costs, and grow your bottom line with confidence.
1. Gross Profit Margin
Gross profit margin shows how much profit your dealership makes after subtracting the cost of sales. This includes the cost of buying vehicles, parts, or services.
It helps you understand if your pricing is effective. If your gross profit margin is low, you may be selling cars too cheaply or paying too much for inventory.
Formula:
Gross Profit Margin = (Gross Profit / Sales) x 100
Benchmarks:
- New Cars: 7-10%
- Used Cars: 12-15%
- Service & Parts: 45-55%
Quick Tip: Use DMS software for expense control. Analyze margins by vehicle model and repair category. Watch out for inventory aging, which often results in margin erosion due to forced discounts.
2. Net Profit Margin
Net profit margin tells you how much money remains after all your expenses—rent, payroll, advertising, etc.—have been paid.
A substantial net profit margin indicates well-controlled operational and fixed costs. If your gross margins are healthy but net profits are low, it’s a red flag that overheads or variable costs are eating into your bottom line.
Formula:
Net Profit Margin = (Net Profit / Sales) x 100
Benchmark: 2-4% (6% is excellent for top-performing stores)
Example: If you make $100,000 in sales and your net profit is $3,000, your net profit margin is 3%.
3. Expense as a Percentage of Gross Profit
This KPI shows how much of your gross profit is used to cover the cost of running the dealership. It helps you gauge operational efficiency. High operating costs (like utilities, insurance, and software) can weaken profits even with substantial revenue.
Formula:
Expense as a Percentage of Gross Profit = (Operating Expenses / Gross Profit) x 100
Benchmark: 75-80%
What to Do: Break this metric down by department. Are service and parts carrying too much overhead? Consider renegotiating vendor contracts or reducing utility wastage.
4. Fixed Absorption Rate
Fixed absorption tells you how much of your overhead is covered by service and parts departments, not car sales. A high fixed absorption rate makes your business more resilient to sales downturns. It reduces dependency on volatile new and used car sales.
Formula:
Fixed Absorption Rate = (Service + Parts + Body Shop Gross Profit / Total Overhead) x 100
Benchmark: 75-100%
Low Fixed Absorption? Focus on increasing service appointments or upselling parts to loyal customers.
5. Selling Expense as a Percentage of Gross Profit
Selling Expenses as a Percentage of Gross Profit shows how much of your profit is consumed by sales-related activities like commissions, bonuses, floorplan interest, and advertising. High selling expenses can indicate inefficient lead generation or overly generous incentive programs that dilute margins.
Benchmark: 30-35%
Formula:
Selling Expense as a Percentage of Gross Profit = (Selling Expenses / Gross Profit) x 100
What to Watch: Monitor the ROI of each ad channel. If you spend heavily on low-converting sources, reallocate the budget toward high-converting digital campaigns.
6. Personnel Expense as a Percentage of Gross Profit
This tracks labor cost as a share of your gross profit, covering wages, benefits, overtime, and bonuses. Labor is often your single most significant expense. This KPI helps you maintain lean staffing without compromising customer experience.
Benchmark: 34-41%
Formula:
Personnel Expense as a Percentage of Gross Profit = (Personnel Expenses / Gross Profit) x 100
Tip: Review technician productivity (flat-rate hours billed vs. clock hours). Use performance-based compensation models to align pay with output better.
7. Advertising Expense as a Percentage of Gross Profit
Advertising Expense as a Percentage of Gross Profit shows whether your marketing spend is proportional to the profit it brings in. If you’re overspending on ads without enough return, it reduces your gross profit.
Benchmark: 7-10%
Formula:
Advertising Expense as a Percentage of Gross Profit = (Advertising Expense / Gross Profit) x 100
Fix It: Revisit your advertising strategies, such as switching from traditional to digital platforms for better ROI.
8. Rent/Occupancy Expense as a Percentage of Gross Profit
This shows how much of your gross profit goes toward maintaining your physical location, including rent, property tax, and utilities. High occupancy costs often mean low flexibility. Even in slow months, these costs don’t change.
Benchmark: 10-12%
Formula:
Rent/Occupancy Expense as a Percentage of Gross Profit = (Rent / Gross Profit) x 100
Pro Tip: If you can’t change your rent, find savings in utilities, facility maintenance, or lease terms.
9. Return on Assets (ROA)
ROA shows how efficiently your dealership uses its assets (like inventory and buildings) to generate profit. A low ROA means you’re not making the most of your assets. It could be time to sell unused inventory or reduce service downtime.
Benchmark: 5-10%
Formula:
Return on Assets (ROA) = Net Income / Total Assets
Example: If you earn $500,000 in net income and your total assets are $10 million, your ROA is 5%.
10. Return on Equity (ROE)
ROE shows how well you’re using shareholders’ or owners equity to make profits. A strong ROE shows that your dealership is a good investment and uses capital wisely.
Benchmark: 15-25%
Formula:
Return on Equity (ROE) = Net Income / Equity
Tip: Use ROE to demonstrate performance to investors or when applying for financing.
How to Integrate KPI Monitoring into Dealership Operations?
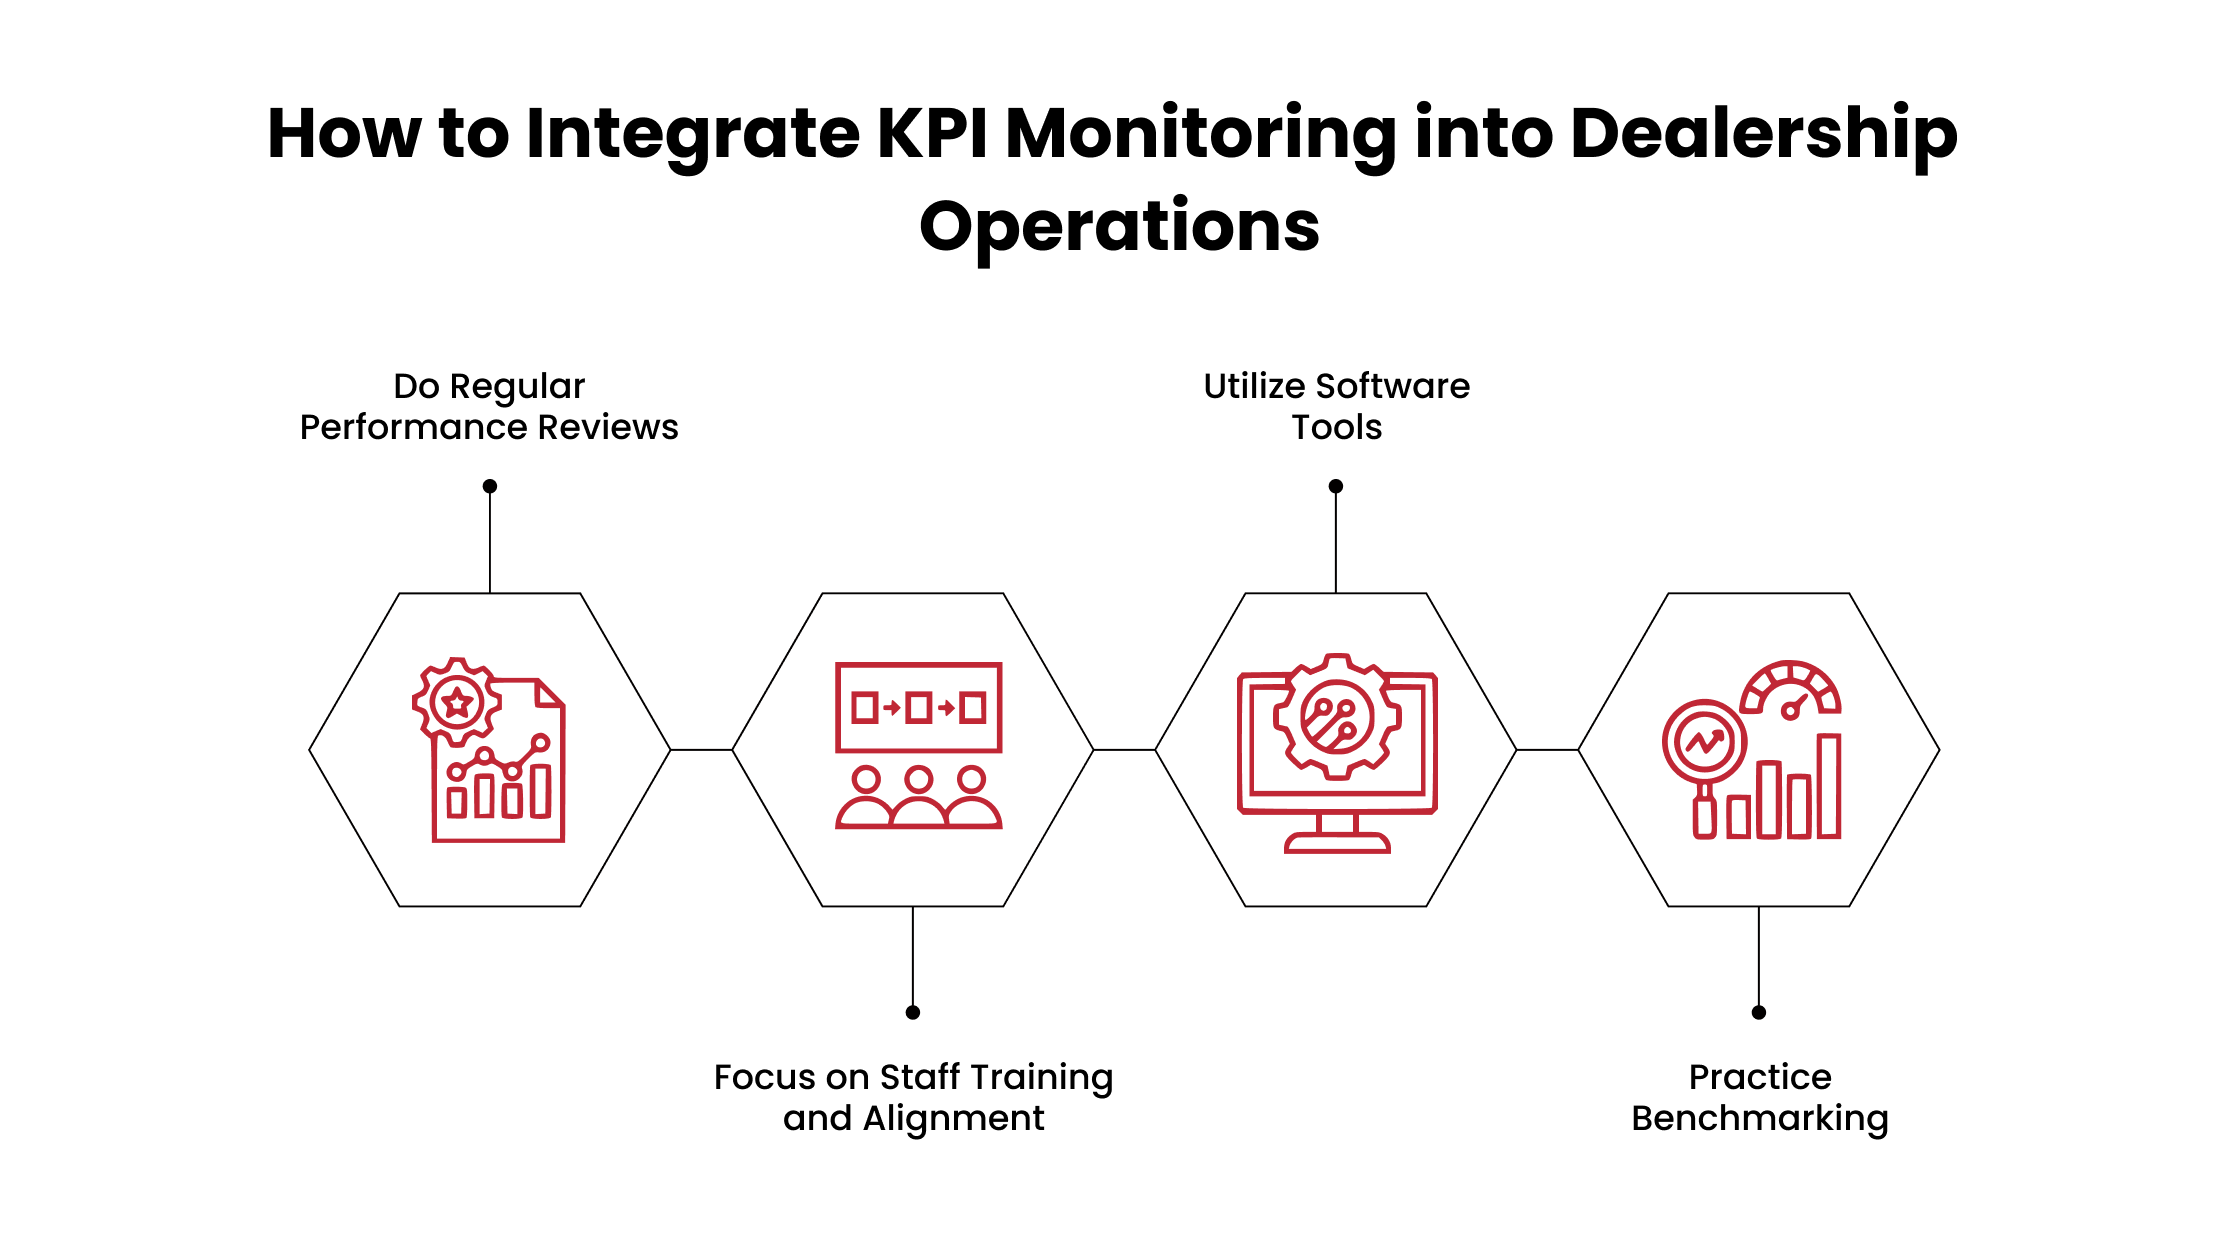
Having the right KPIs is only half the battle. Successful dealerships embed these KPIs into their day-to-day operations through:
1. Do Regular Performance Reviews
Conduct weekly or monthly reviews of KPI dashboards. Highlight areas where performance is lagging and assign corrective actions.
2. Focus on Staff Training and Alignment
Ensure all departments, sales, service, and F&I, understand the relevant KPIs. Align bonus structures with KPI targets to drive accountability. At ATN, we specialize in providing tailored training programs and performance alignment strategies that help your team stay focused on the metrics that truly impact your dealership’s profitability.
3. Utilize Software Tools
Track these KPIs in real time using dealership management systems (DMS) and business intelligence platforms. Many tools offer visual dashboards and trend reports.
4. Practice Benchmarking
Compare KPIs against national or regional benchmarks provided by organizations like NADA or manufacturers. This helps set realistic, competitive targets.
Common Mistakes Dealerships Make When Tracking KPIs
Even when dealerships actively track KPIs, several common mistakes can limit their effectiveness:
Overemphasizing Sales Metrics
Focusing too heavily on sales figures while neglecting expense-related KPIs can hide underlying issues. If costs aren't adequately managed, high sales may lead to low profits.
Using Outdated or Inconsistent Data
KPI data must be current and accurate. Relying on outdated reports or manual tracking increases the risk of poor decisions. A real-time dealership management system (DMS) is crucial.
Tracking Too Many KPIs at Once
Monitoring every possible metric can overwhelm your team. Instead, focus on a handful of high-impact KPIs directly influencing profitability and operational efficiency.
Ignoring KPI Insights
Simply collecting data isn’t enough. The real value comes from using KPI insights to identify issues, adjust strategies, and improve performance.
Failing to Align KPIs Across Departments
Ensure that all departments understand and align with the dealership’s primary KPIs. This creates accountability and promotes unified business goals.
By avoiding these pitfalls, dealerships can make KPI tracking a powerful tool for profitability and growth.
Addressing Data Quality Issues in KPI Tracking
Even the best KPIs fall flat without clean, accurate data behind them. Poor data quality, whether from typos, missing entries, or outdated systems, can skew your metrics and lead to poor decisions. If your data doesn’t reflect reality, your strategy won’t either.
Data Validation:
To ensure your KPIs tell the right story, start with data validation. Make sure every data point—sales figures, service metrics, customer feedback—is accurate and relevant. Follow this up with regular audits to catch inconsistencies before they snowball.
Employee Training:
Equally important is employee training. Your staff should understand the “why” behind data accuracy, not just how to enter numbers, but how their diligence impacts overall performance.
Using Automated Tools:
Automated tools like CRM integrations or DMS analytics platforms can also reduce human error and deliver real-time, reliable insights.
Data Integrity:
Finally, build a culture that values data integrity. When everyone from service advisors to sales managers takes ownership of the data they input, your KPIs become more than just numbers, they become the foundation for smarter, faster, and more profitable decisions.
By addressing data quality challenges through comprehensive training and the right resources, ATN ensures your team is fully equipped to maintain accurate KPIs and drive impactful results.
Align Your Dealership’s Profit Strategy with Expert-Led Training by ATN

Want to master the KPIs that truly impact your dealership sales? At Automotive Training Network (ATN), we go beyond generic advice to offer customized training and consulting designed to align your expenses with gross profit. Our hands-on programs help dealerships measure what matters—so you can reduce waste, boost efficiency, and drive sustainable growth.
Our comprehensive solutions are designed to empower your team, optimize operations, and drive lasting success across every department—from Sales and BDC to Finance and Fixed Ops.
Here’s how ATN delivers results:
- Virtual Training: Flexible, customized online sales and service sessions led by experienced coaches who focus on your dealership’s unique goals and challenges.
- 4-Day Bootcamps: Intensive workshops in Scottsdale that equip your Sales and BDC teams with proven tools, scripts, and strategies to maximise performance.
- In-Dealership Training: Hands-on coaching delivered on-site by expert instructors, tailored to your team’s specific strengths, weaknesses, and opportunities.
- Consulting Services: Strategic advisory support covering financial analysis, executive development, and operational improvements to ensure your goals align with results.
- Managed Store Services: Whether independent or franchise, we act as your dedicated General Manager—applying a hands-on, data-driven approach to guarantee profitability.